

New analysis highlights the great education divide across Britain
22 July 2011
Different areas of the same cities and counties in Britain have huge disparities in educational achievement, warns new analysis released today.
The analysis, from UCU, reveals 'two Britains' divided between the educational haves and have nots. It ranks the 632 parliamentary constituencies in England, Scotland and Wales according to the percentage of working age people (16-64) who have no qualifications.
The contrasts are extreme. In some constituencies, such as Glasgow East and Birmingham Hodge Hill, more than one in three people have no qualifications, compared to just one in 50 in others such as Brent North and Romsey and Southampton North.
The union looked at the overall picture and analysed 21 individual cities and surrounding areas* and discovered many examples of the educational haves and have nots living side by side. People living in Newcastle-upon-Tyne Central, for example, are almost twice as likely to have no qualifications compared to people in neighbouring Newcastle-upon-Tyne North.
Of the 20 constituencies with the highest percentage of people with no qualifications, the West Midlands accounts for eight of them and has four in the top ten. There is a clear east/west divide in London; of the 20 worst performing constituencies in the capital, three-quarters are in the east. In contrast, a similar proportion of the best performing constituencies are in the west.
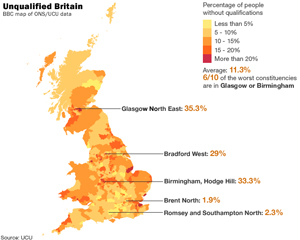
In Scotland, Glasgow has three constituencies ranked in the worst 10 in Britain for people lacking qualifications. In contrast, all of Edinburgh's constituencies are well above average, with fewer than one in ten people without qualifications.
The percentage of people without qualifications varies across Britain. In England 11.1% have no qualifications, in Scotland the figure rises above the 11.3% British average to 12.3% and in Wales it is 13.3%.
| Country | Percentage with no qualifications |
| England | 11.1 |
| Scotland | 12.3 |
| Wales | 13.3 |
| Britain | 11.3 |
The union said that the areas with the lowest levels of qualifications were most likely to suffer from a cocktail of coalition policies that will restrict access to education:
- education maintenance allowances for teenagers have been axed
- up to 300,000 adults on inactive benefits are set to face prohibitive charges of £1,000 a year to study
- tuition fees have tripled and are now the highest public university fees in the world
- fees and loans are to be introduced for working adults who want to retrain.
UCU general secretary, Sally Hunt, said: 'There are two Britains living side by side - one with education, and the massive personal benefits it can bring, and the other without.
'Education is central to our country's future, yet in some places thousands of people still have no qualifications. There is a real danger that children growing up in certain areas will have their ambition blunted and never realise their full potential.
'The government needs to urgently revisit its education policies if we are to really offer improved life chances to all. Introducing fees for people on benefits who wish to study, for example, is incredibly counterproductive. We should be encouraging people to strive for qualifications, not pricing them out.'
Top 20 table - constituencies with fewest people with no qualifications
| Constituency | Percentage with no qualifications | Rank |
| Brent North | 1.9 | 1 |
| Romsey and Southampton North | 2.3 | 2 |
| Wimbledon | 2.6 | 3 |
| Winchester | 2.6 | 3 |
| Leeds North West | 2.7 | 5 |
| Cambridge | 2.8 | 6 |
| Mole Valley | 2.8 | 6 |
| Buckingham | 3.1 | 8 |
| Macclesfield | 3.1 | 8 |
| Hitchin and Harpenden | 3.3 | 10 |
| Croydon South | 3.4 | 11 |
| East Hampshire | 3.5 | 12 |
| Wantage | 3.5 | 12 |
| Hertford and Stortford | 3.6 | 14 |
| Guildford | 3.7 | 15 |
| Aylesbury | 3.8 | 16 |
| Orpington | 3.8 | 16 |
| Richmond Park | 3.8 | 16 |
| Cheadle | 4.0 | 19 |
| Barrow and Furness | 4.1 | 20 |
| North East Hampshire | 4.1 | 20 |
ONS annual population survey Jan 2010 - Dec 2010
Bottom 20 table - constituencies with most people with no qualifications
| Constituency | Percentage with no qualifications | Rank |
| Glasgow North East | 35.3 | 1 |
| Birmingham, Hodge Hill | 33.3 | 2 |
| Bradford West | 29.0 | 3 |
| Glasgow East | 29.0 | 3 |
| Derby South | 26.1 | 5 |
| Liverpool, Walton | 24.6 | 6 |
| Birmingham, Ladywood | 24.5 | 7 |
| Glasgow South West | 23.9 | 8 |
| Motherwell and Wishaw | 23.8 | 9 |
| Birmingham, Hall Green | 23.7 | 10 |
| West Bromwich East | 23.7 | 10 |
| Birmingham, Erdington | 23.1 | 12 |
| Clacton | 23.0 | 13 |
| Airdrie and Shotts | 22.8 | 14 |
| Wolverhampton North East | 22.4 | 15 |
| Wolverhampton South East | 22.3 | 16 |
| Boston and Skegness | 22.0 | 17 |
| Bradford East | 21.9 | 18 |
| Walsall North | 21.6 | 19 |
| Glasgow Central | 21.3 | 20 |
ONS annual population survey Jan 2010 - Dec 2010
Download the figures:
 Full data [96kb] |
 Regional breakdowns [384kb]
- PrintPrint this page
- Share
Comments